View Relay "dismal"
Fingerprint: BC67DB594CBE96563AFE2CE165F2C107130FB2F0 |
Family: 11 relays
|
Satanist <admin AT 2cb dot su> |
AS200912
|
Netherlands
|
Linux
- Consensus
- In Consensus (9/9 Directory Auths)
- DNS Health
- Healthy (18.4s, 91st percentile) (via exitdnshealth.1aeo.com)
- BW Verified
- 5/7 BW Auths Measured 360 Mbit/s Median
- Stability
- Overloaded | UP 5d 12h 25m ago | UP 99% (1M)
- Reachability
- IPv4: 9/9 | v6: 8/8(Directory Auths)
- BW Weight
- 0.02% of Network | 250 Mbit/s Observed By Relay
- Version
- 0.4.9.15 Recommended
-
General Overload Active
: Relay reported general overload at 2026-11-03 15:00 UTC. Reported timestamps use hour precision, so the displayed minute is not an exact incident time. The flag does not identify which trigger fired. Investigation paths are Tor's internal OOM handling, dropped ntor onionskins, and TCP port exhaustion.
Suggestion: Inspect CPU and memory with htop, Tor service logs, host or container memory headroom, and the effective MaxMemInQueues. When the process was killed or restarted, check kernel OOM logs separately. A kernel OOM kill is a different mechanism from Tor freeing memory itself. MetricsPort: tor_relay_load_oom_bytes_total. Broken down by subsys. An increase measures bytes freed by Tor’s internal OOM handling. It is not an invocation count and it is not proof of a kernel OOM kill. Review Tor’s onionskin and drop messages, and whether the CPU is saturated or contended. The general-overload flag does not say this trigger fired. MetricsPort: tor_relay_load_onionskins_total{type="ntor",action="dropped"} and {type="ntor_v3",action="dropped"}. Compare each with the matching action="processed" series. Inspect both supported handshake types. Review Tor logs, socket usage, and the host’s ephemeral-port allocation. On Linux, ss -s and reading net.ipv4.ip_local_port_range are useful starting checks. MetricsPort: tor_relay_load_tcp_exhaustion_total. An increase records additional exhaustion events. See the Tor overload troubleshooting guide.
Addresses
- OR Address
-
tor-exit.nl2.2cb.li
31.58.216.18:9001
[2a14:c380:26:10::]:9001 - Exit Address
- 31.58.216.18
Reachability (Directory Authorities)
- IPv4
- 9/9
- IPv6
- 8/8 (1 don't test)
Location
- Country
-
 Netherlands
- Interactive Map
- View in RouteFluxMap
Eligibility Flag Vote Details
| Flag | Metric | Status | Relay Value | Threshold Required |
|---|---|---|---|---|
| Running | IPv4 Reachability | Meets (9/9 DA) | 9/9 authorities reached relay | ≥5/9 DA ORPort reachable |
| IPv6 Reachability | Meets (8/8 DA) | 8/8 tested authorities reached relay | ≥5/8 tested (majority) (≥5/8 DA) | |
| Valid | Descriptor | Meets (9/9 DA) | 9/9 authorities assigned Valid | Not blacklisted + valid descriptor (≥5/9 DA) |
| V2Dir | DirPort Available | Meets (9/9 DA) | Tunnelled: Yes (no DirPort) (R) | Tunnelled directory via ORPort or DirPort (≥5/9 DA) |
| Fast | Speed | Meets (9/9 DA) | 352.0 Mbit/s – 400.0 Mbit/s (5 DA measured) 80.0 Mbit/s (4 DA relay-reported) |
≥816.0 Kbit/s (AuthDirFastGuarantee, or the top-7/8 cutoff if lower) (≥5/9 DA) [Stricter] moria1: ≥8.4 Mbit/s |
| Stable | MTBF | Partial (7/9 DA) | Median: 13.2d (7/9 DA above threshold) Min/Max: 4.5d / 5113.0d (9/9 DA, Voting / Total Eligible) |
≥2.4d - 9.5d (varies) (≥5/9 DA) [Stricter] moria1: ≥7621.1d |
| Uptime | Meets (9/9 DA) | 5.5d (R) | ≥5.2d - 5.5d (varies) (≥5/9 DA) | |
| HSDir | Prereq: Fast | Meets (9/9 DA) | 9/9 DA assigned Fast 352.0 Mbit/s – 400.0 Mbit/s (5 DA measured) 80.0 Mbit/s (4 DA relay-reported) |
≥816.0 Kbit/s (AuthDirFastGuarantee, or the top-7/8 cutoff if lower) (≥5/9 DA) [Stricter] moria1: ≥8.4 Mbit/s |
| Prereq: Stable | Meets (9/9 DA) | 9/9 DA assigned Stable | ≥2.4d - 9.5d (varies) (≥5/9 DA) [Stricter] moria1: ≥7621.1d |
|
| Prereq: V2Dir | Meets (9/9 DA) | 9/9 DA assigned V2Dir | Tunnelled directory via ORPort or DirPort (≥5/9 DA) | |
| Uptime | Partial (8/9 DA) | 5.5d (R) | ≥96h as each authority sees it (MinUptimeHidServDirectoryV2) (≥5/9 DA) [Stricter] moria1: ≥98% WFU and ≥9.9d Time Known |
|
| Guard | Prereq: Fast | Meets (9/9 DA) | 9/9 DA assigned Fast 352.0 Mbit/s – 400.0 Mbit/s (5 DA measured) 80.0 Mbit/s (4 DA relay-reported) |
≥816.0 Kbit/s (AuthDirFastGuarantee, or the top-7/8 cutoff if lower) (≥5/9 DA) [Stricter] moria1: ≥8.4 Mbit/s |
| Prereq: Stable | Meets (9/9 DA) | 9/9 DA assigned Stable | ≥2.4d - 9.5d (varies) (≥5/9 DA) [Stricter] moria1: ≥7621.1d |
|
| Prereq: V2Dir | Meets (9/9 DA) | 9/9 DA assigned V2Dir | Tunnelled directory via ORPort or DirPort (≥5/9 DA) | |
| WFU | Meets (9/9 DA) | Median: 99.8% (9/9 DA above threshold) Min/Max: 98.6% / 99.9% (9/9 DA, Voting / Total Eligible) |
≥98%; dizum: ≥97.87300000000001% (≥5/9 DA) | |
| Time Known | Meets (9/9 DA) | Median: 22.1d (9/9 DA above threshold) Min/Max: 9.8d / 23.8d (9/9 DA, Voting / Total Eligible) |
≥8 days (≥5/9 DA) | |
| Bandwidth | Meets (9/9 DA) | 352.0 Mbit/s – 400.0 Mbit/s (5 DA measured) 80.0 Mbit/s (4 DA relay-reported) |
≥16.8 Mbit/s (AuthDirGuardBWGuarantee) OR top 25% (≥80.0 Mbit/s-272.0 Mbit/s) (≥5/9 DA) | |
| Exit | Exit Policy | Meets (9/9 DA) | Port 80: Yes | Port 443: Yes (R) | Allows ≥1 /8 on ports 80 AND 443 (≥5/9 DA) |
(DA) = Dir. Auth. Measured |
(R) = Relay Reported
Data from Tor CollecTor (authority votes, fetched 2026-11-04 18:45:05).
Capacity (Relay Reported)
- Observed Bandwidth
- 250.75 Mbit/s
- Advertised Bandwidth
- 250.75 Mbit/s
- Rate Limit
- 8.59 Gbit/s
- Burst Limit
- 8.59 Gbit/s
- Total Data
-
662 TB
(1 year)
1mo: 79 TB | 6mo: 430 TB | 1y: 662 TB
Measurement (Directory Authority Verified)
Source: CollecTor — fetched 2026-11-04 18:45:05
- Measured By
-
5/7
Bandwidth Authorities
Not measured by: faravahar, longclaw - Consensus Weight
- 360.0 Mbit/s (median of 5 measurements)
- Measured Min / Max
- 352.0 Mbit/s / 400.0 Mbit/s
History
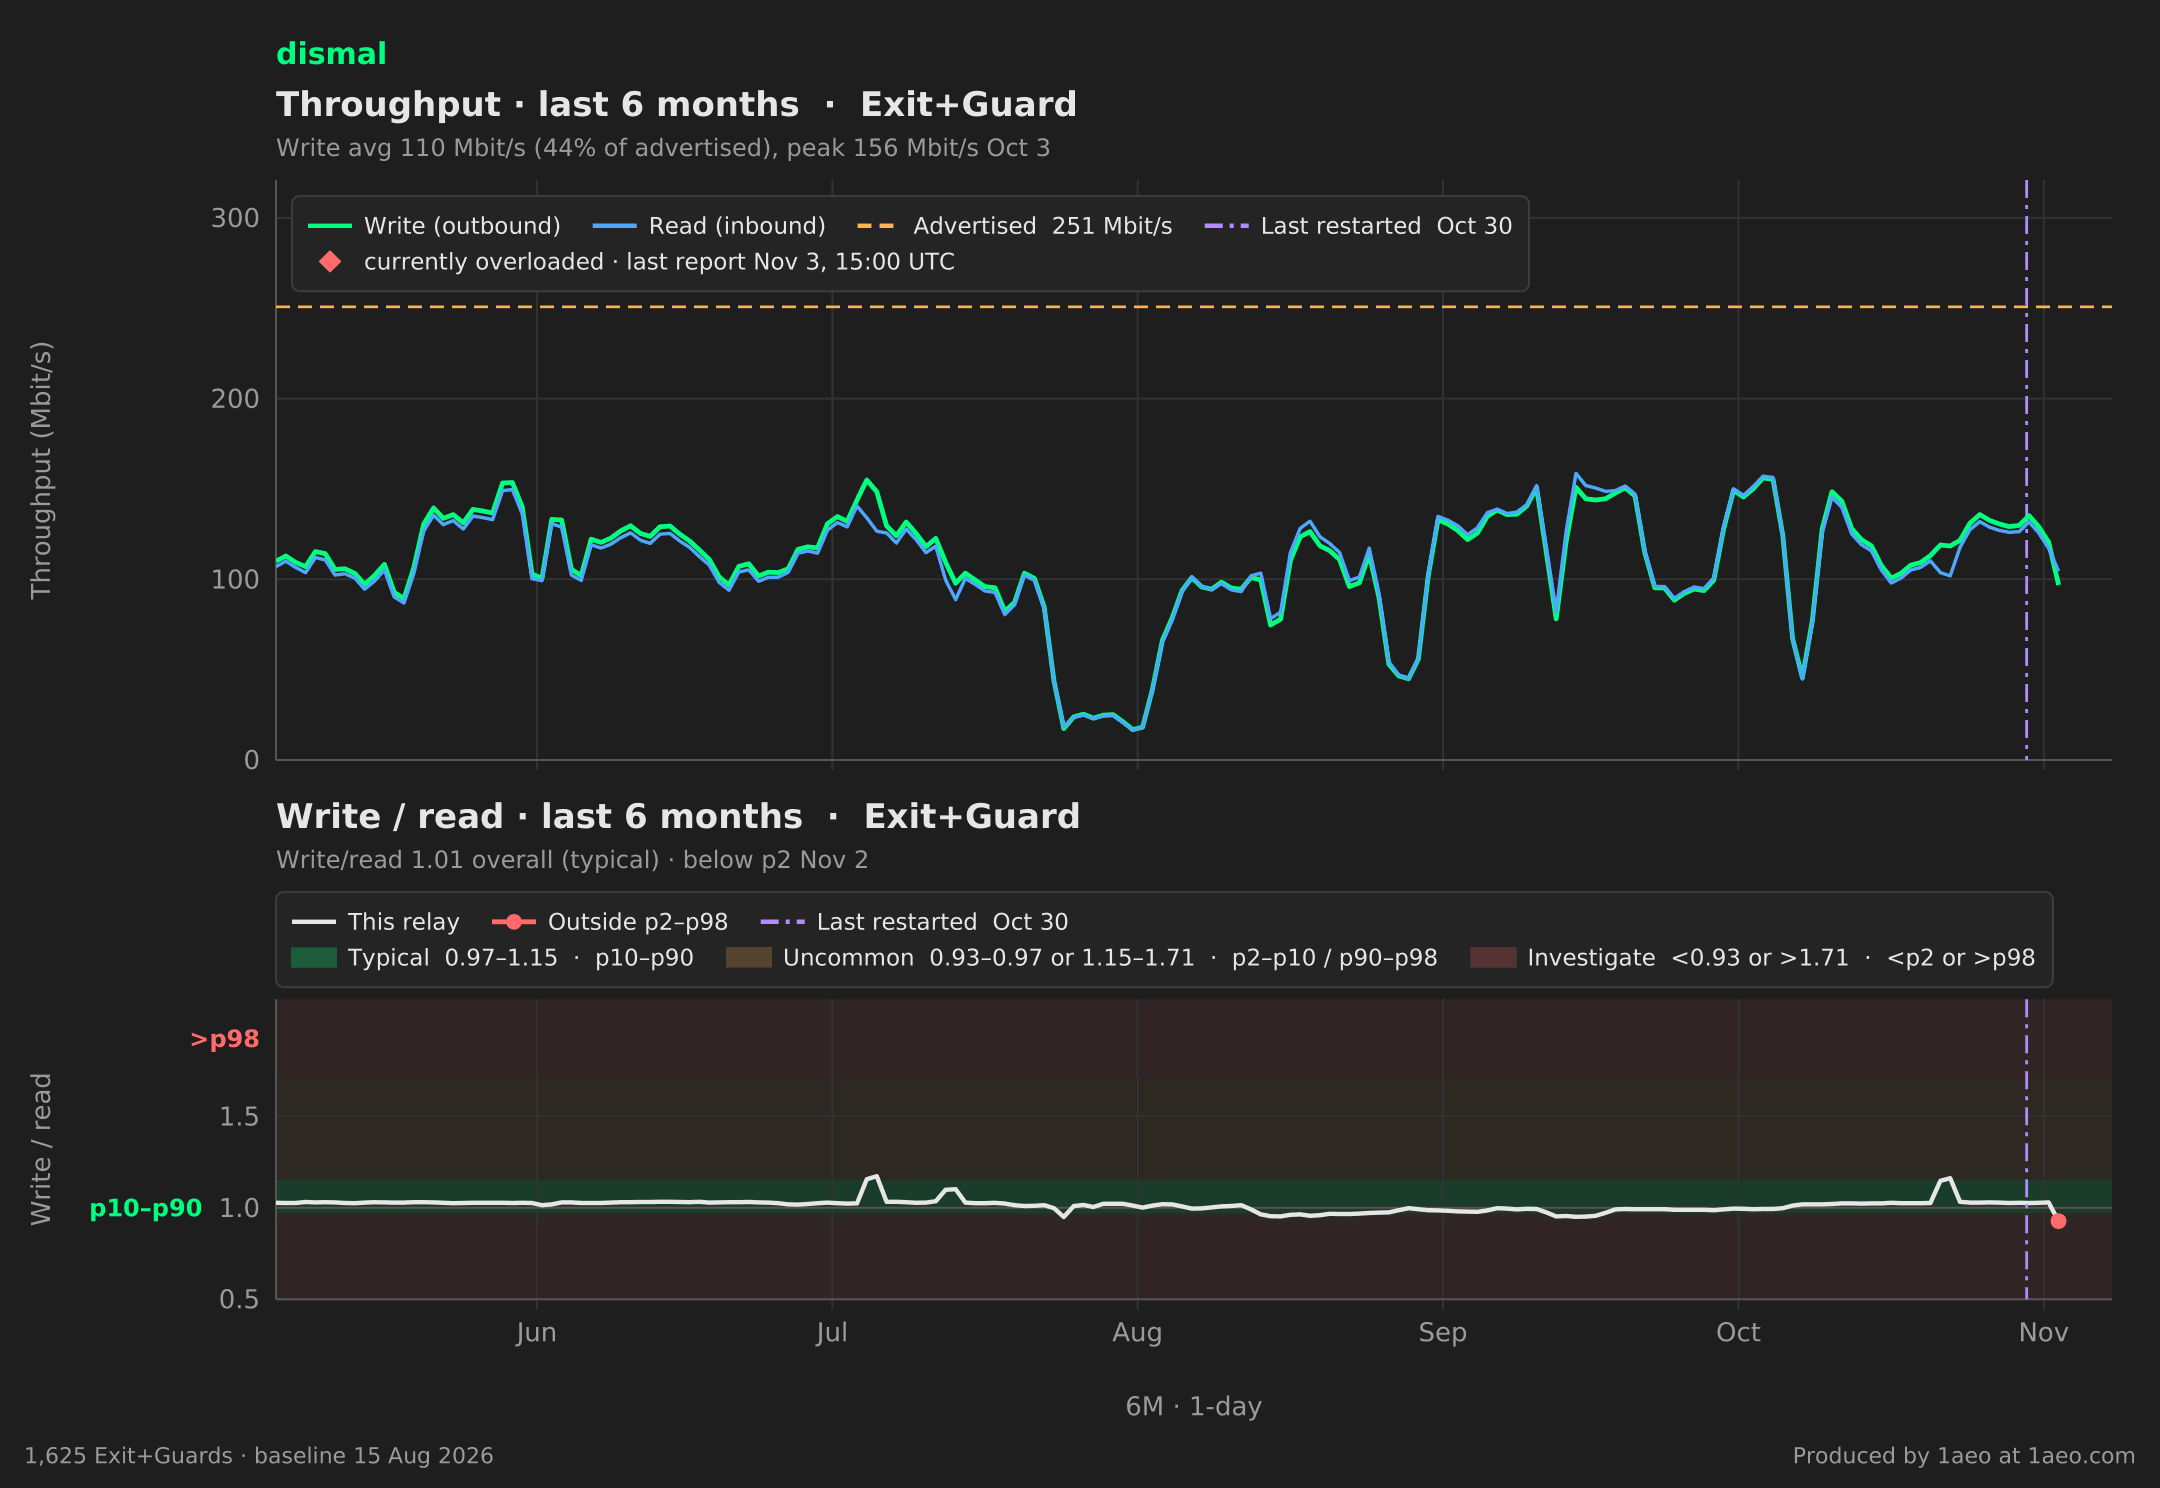
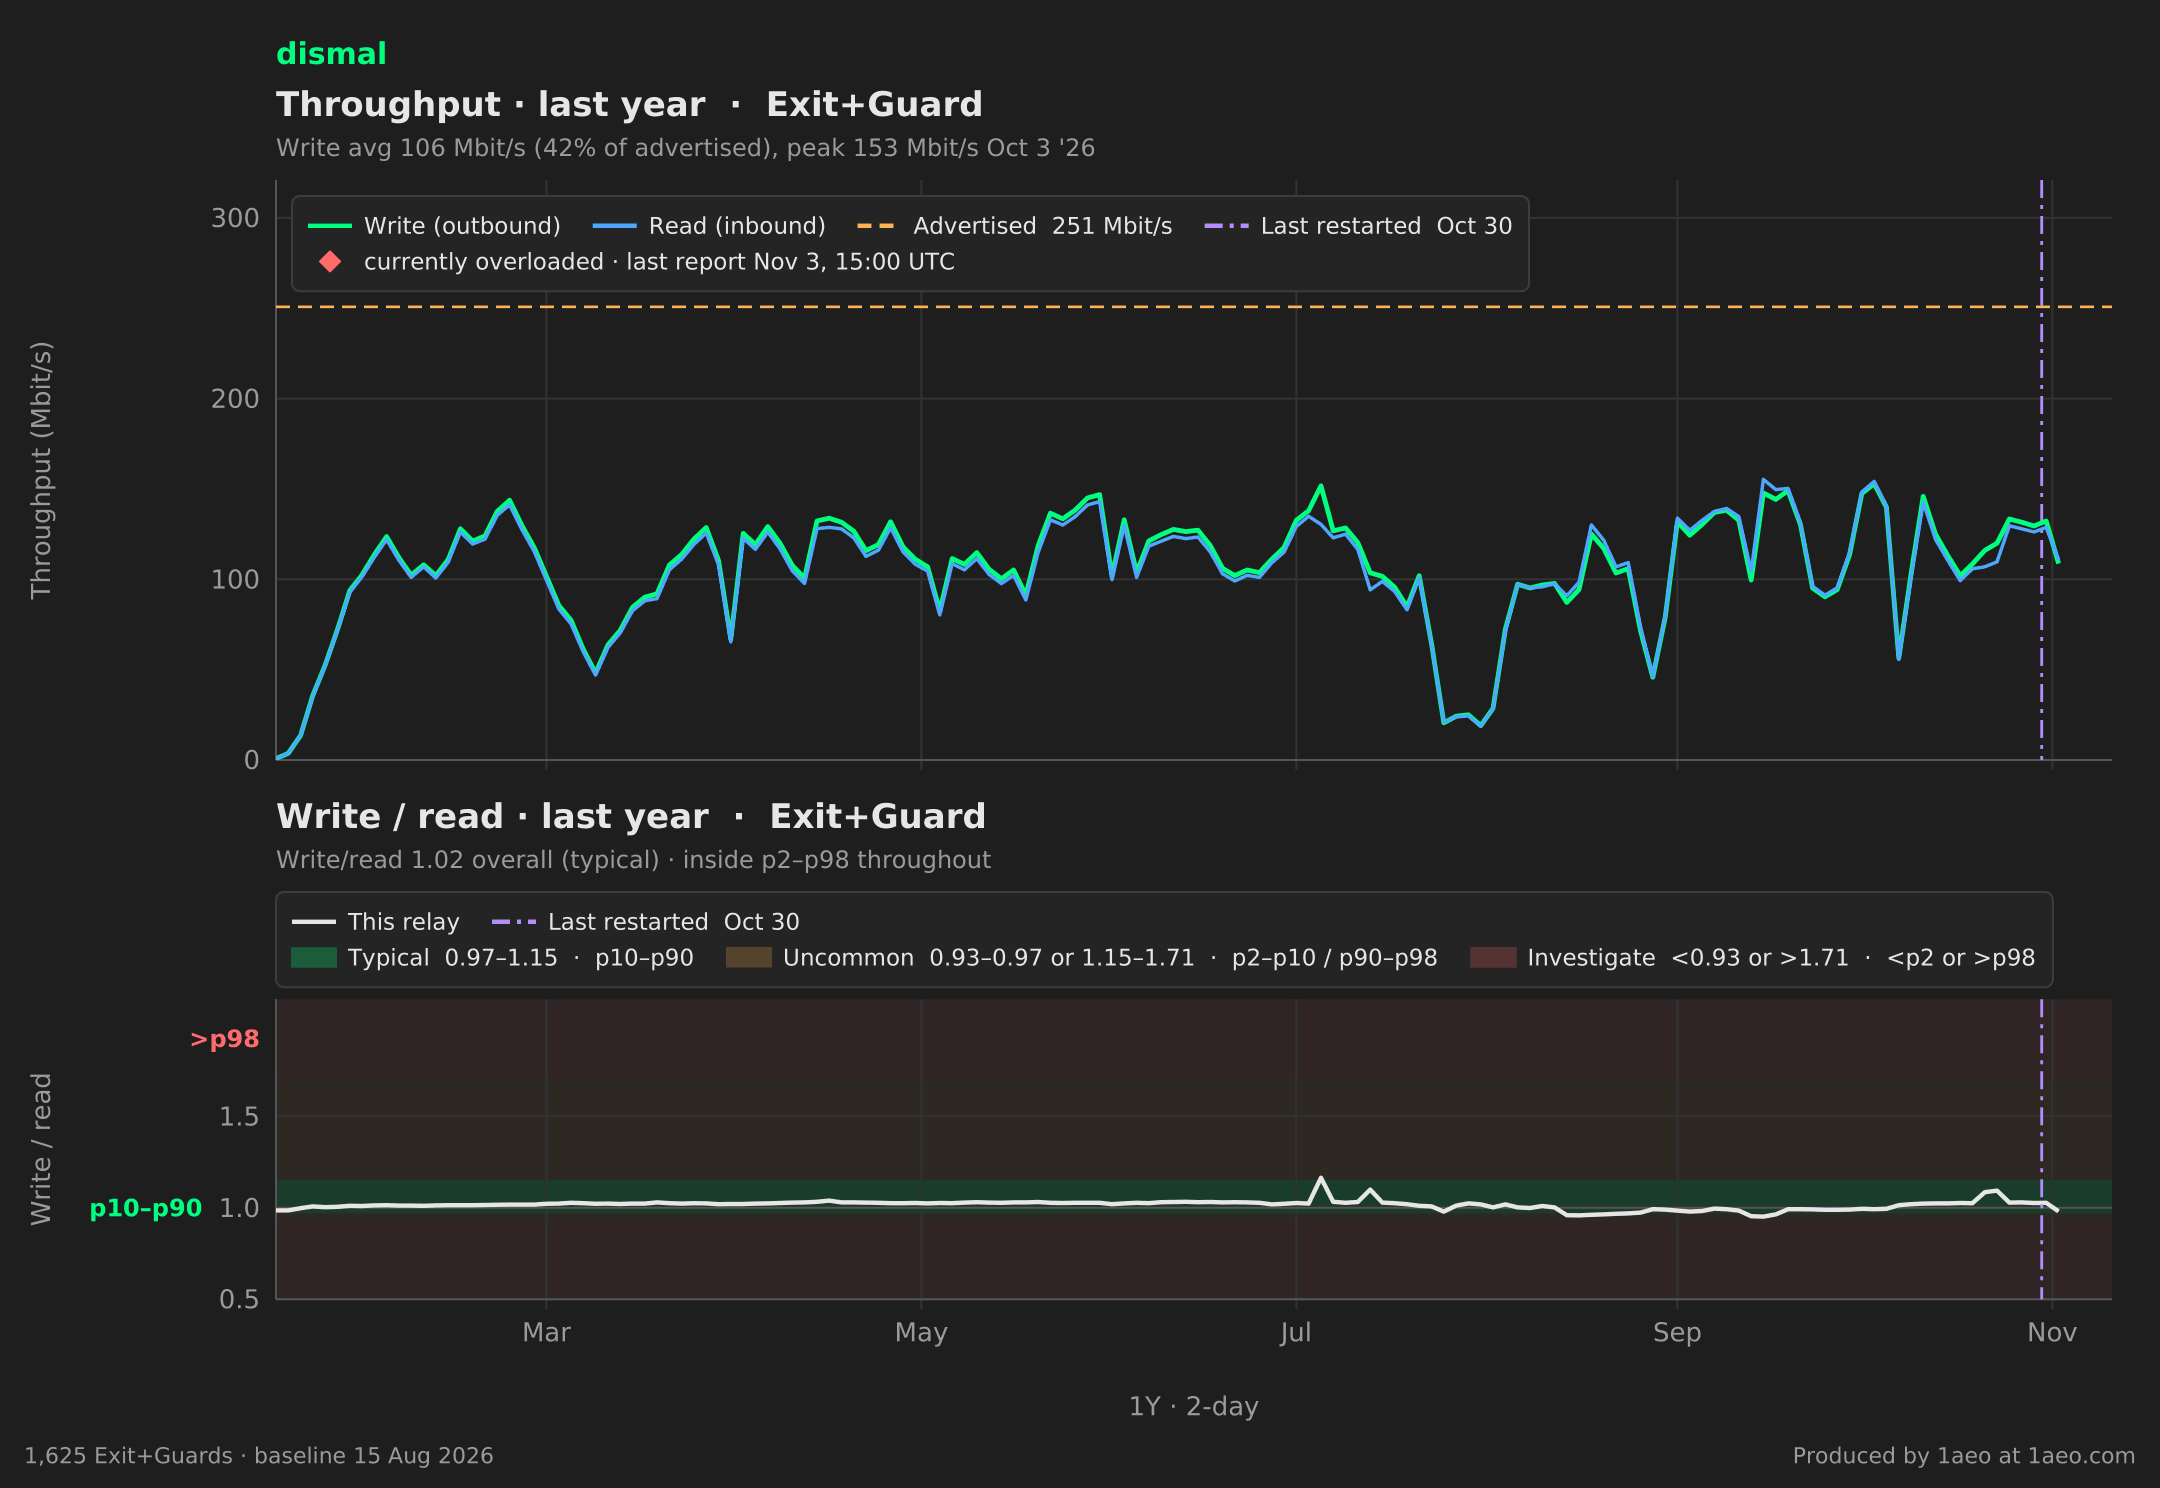
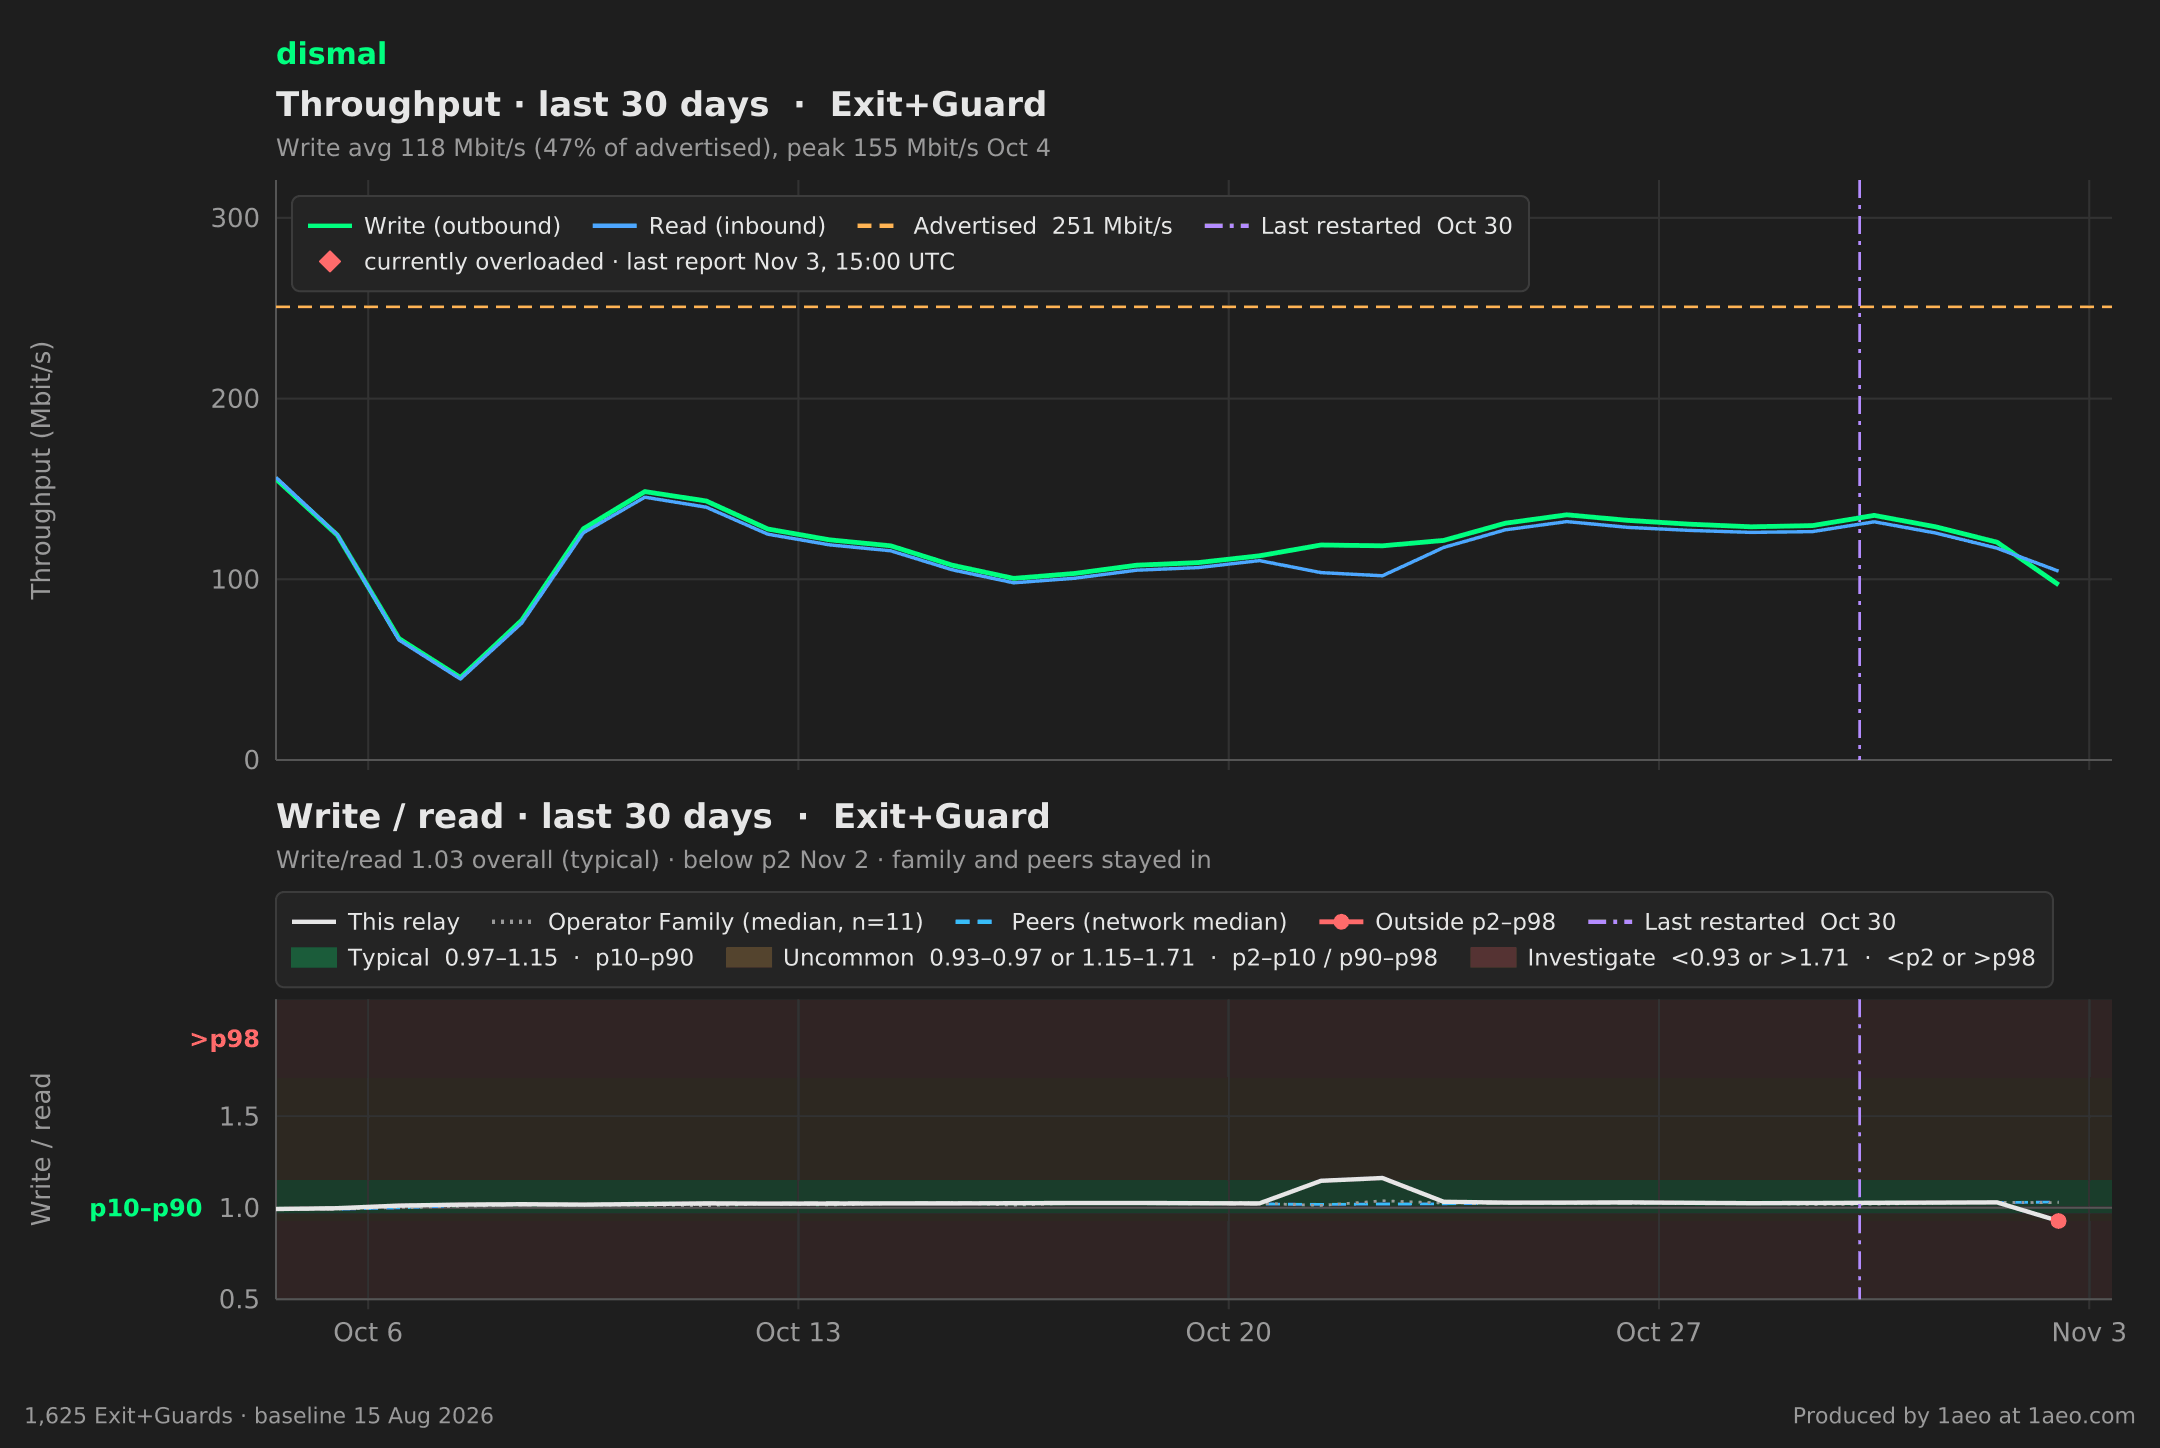
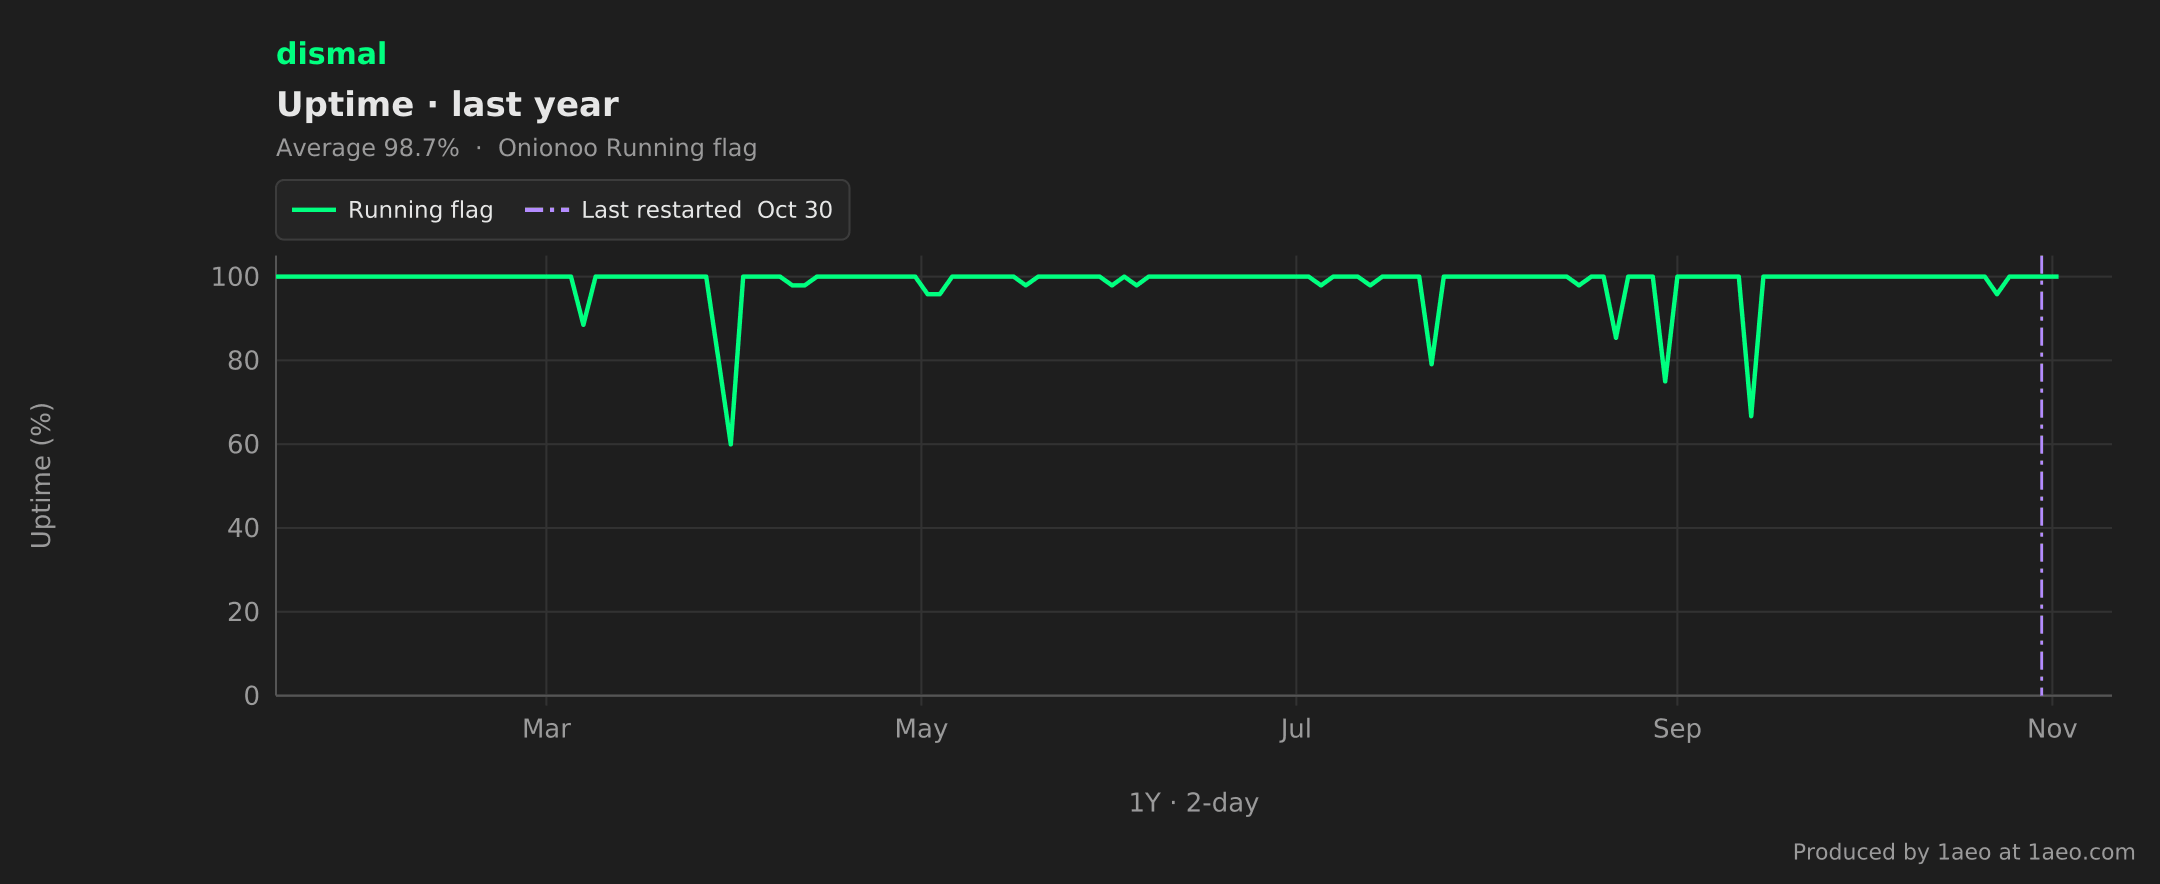
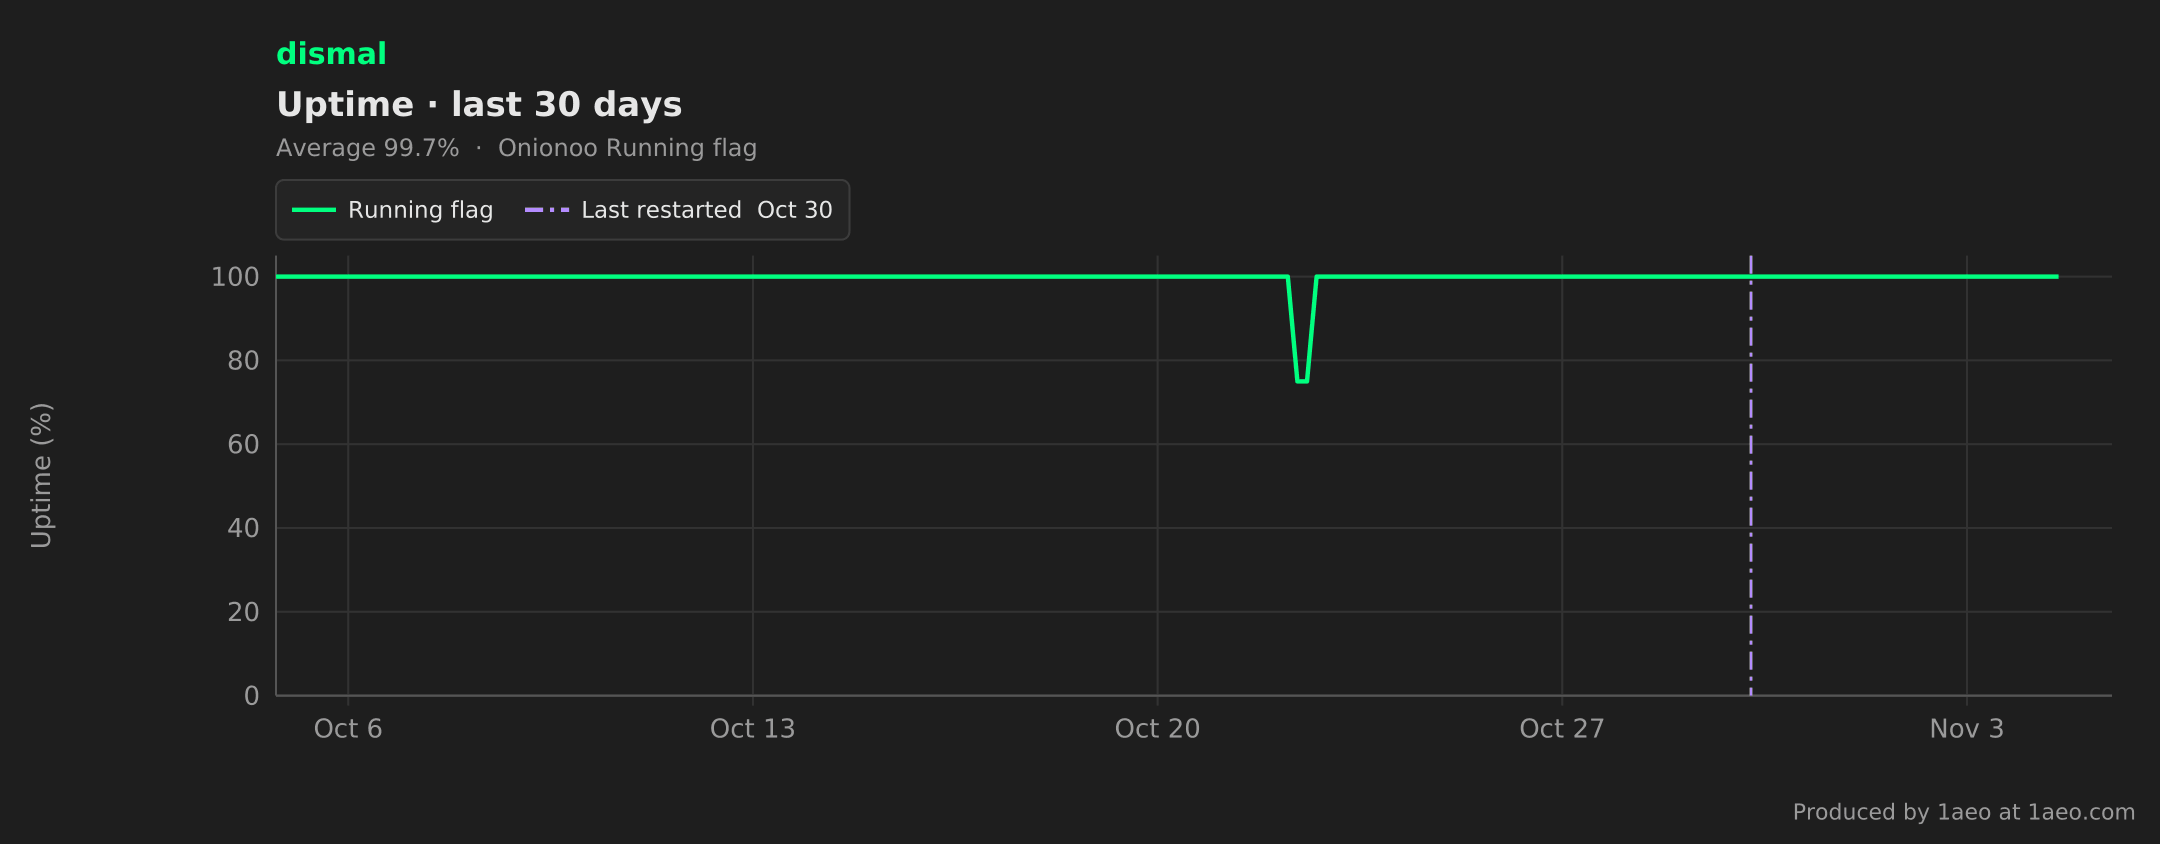
Uptime Metrics
- Current Status
- UP 5d 12h 25m ago
- Overall Uptime (1M/6M/1Y/5Y)
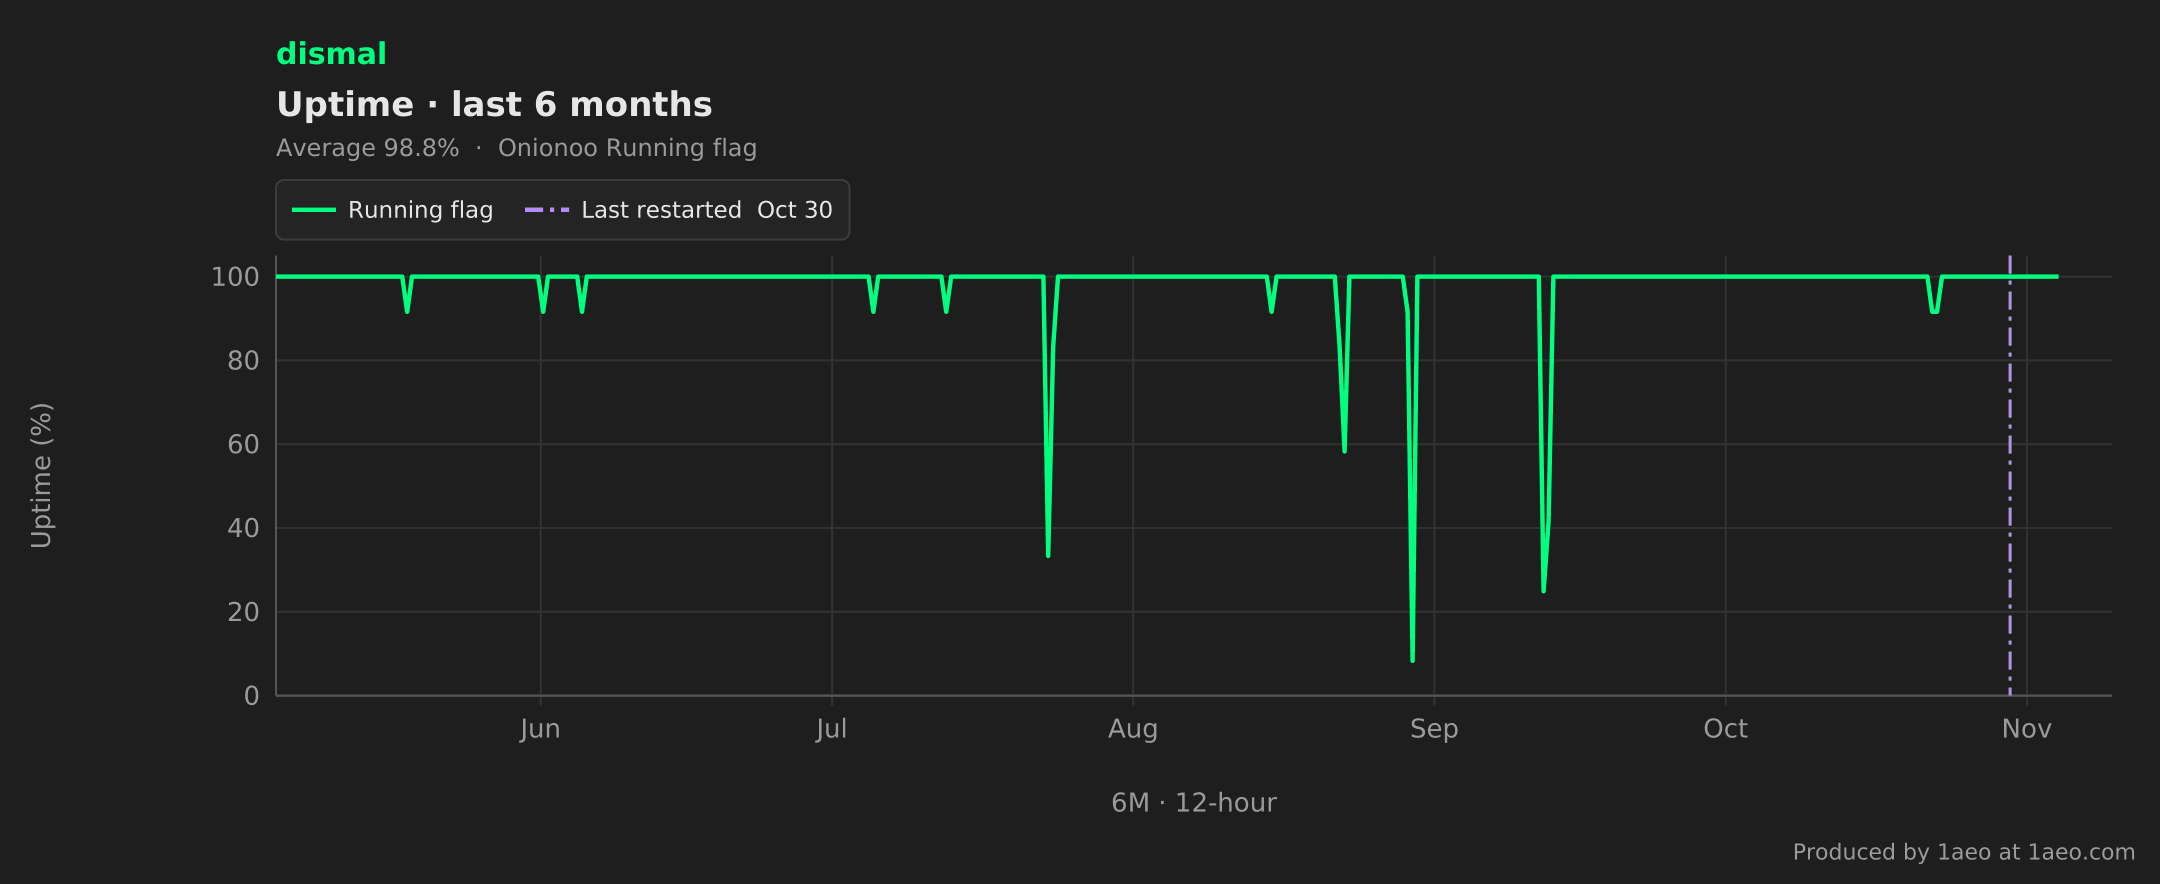
- 99.7%/98.8%/98.7%/0.0%
- Flag Uptime (1M/6M/1Y/5Y)
- Matches Overall Uptime (99.7%/98.8%/98.7%/0.0%)
- Hibernating
- No
Timestamps
- First Seen
- 9mo 3w 2d ago (2026-01-15 13:00:00)
- Last Seen
- 1h 45m 16s ago (2026-11-04 17:00:00)
- Last Restarted
- 5d 12h 25m ago (2026-10-30 06:19:52)
- Last Changed Address
- 2026-08-29 23:00:00
Evaluated 2026-11-04 18:45 UTC. /details snapshot 2026-11-04 17:00:00 UTC (cached 21s ago). /bandwidth snapshot 2026-11-04 05:00:00 UTC (cached 11h ago).
Reported timestamps use hour precision, so the displayed minute is not an exact incident time.
General Overload (from /details)
- Status
- Reported
- When
- 2026-11-03 15:00 UTC (1 day ago)
The general-overload flag does not say which trigger fired. Possible paths are Tor’s internal memory handling, dropped ntor handshakes, and TCP port exhaustion. Allium treats a valid report as eligible for 72 hours; that cutoff is not proof the relay recovered then.
File Descriptor Exhaustion (from /bandwidth)
- Status
- No file-descriptor exhaustion report in available data
Rate Limits (from /bandwidth)
- Status
- No rate-limit report in available data
- Rate Limit
- —
- Burst Limit
- —
- Write counter
- —
- Read counter
- —
What to check
-
Tor internal memory pressure
Inspect CPU and memory with htop, Tor service logs, host or container memory headroom, and the effective MaxMemInQueues. When the process was killed or restarted, check kernel OOM logs separately. A kernel OOM kill is a different mechanism from Tor freeing memory itself.MetricsPort:
tor_relay_load_oom_bytes_total— Broken down by subsys. An increase measures bytes freed by Tor’s internal OOM handling. It is not an invocation count and it is not proof of a kernel OOM kill. -
ntor handshake pressure
Review Tor’s onionskin and drop messages, and whether the CPU is saturated or contended. The general-overload flag does not say this trigger fired.MetricsPort:
tor_relay_load_onionskins_total{type="ntor",action="dropped"} and {type="ntor_v3",action="dropped"}— Compare each with the matching action="processed" series. Inspect both supported handshake types. -
TCP port exhaustion
Review Tor logs, socket usage, and the host’s ephemeral-port allocation. On Linux, ss -s and reading net.ipv4.ip_local_port_range are useful starting checks.MetricsPort:
tor_relay_load_tcp_exhaustion_total— An increase records additional exhaustion events.
About these reports and MetricsPort
Allium’s eligibility windows are applied to the reported timestamps: 72 hours for general overload and file-descriptor exhaustion, 24 hours for a rate-limit hit. A report at the cutoff is historical. An older report can remain visible after Onionoo or Allium’s cache still has it. The cutoff does not prove the relay recovered at that moment. Allium caches the bandwidth document for 12 hours by default. The snapshot time is when Onionoo published that document. It is not the relay’s event time, and it is not necessarily the extra-info publication time. Cache age is how old Allium’s copy is.
MetricsPort counters are cumulative. Compare samples, and account for process restarts. A nonzero total alone does not show ongoing activity. Gauges describe current values. An unavailable metric is unknown, not zero. Allium does not have this relay’s MetricsPort readings and does not invent them.
The port below is an example for an endpoint you have already configured. MetricsPort must be enabled with restricted access and must not be exposed publicly. Setup stays in the Tor overload troubleshooting guide.
curl http://127.0.0.1:9035/metrics
History
Operator Identity
Source: AROI Validation API — 2026-11-04 10:00 UTC
- AROI Domain (?)
- Not specified
- Operator Validation
- Unvalidated
- This Relay
- N/A (no AROI configured)
- Contact
- Satanist <admin AT 2cb dot su>
Family Configuration
- Family Support
- Both — Happy Families (11 / 92%) and MyFamily (1 / 8%) | View Full Family (11)
- Effective Members: 11
18247BF4BF9357E0F1066AC5B7772F7D19B71DE7
242B7DD7F589BD3644F60D3C8D688006F8613A27
3E10B71C4D1B9CF960758E81D6E43D117DE3EDEA
46E5BA57B6BFB2E34DF53B5CCC9D8B80BE2CADE2
518F58F70E8C07F2BC63C20A0A5907A39152FEA3
5D1ACF7998E783EE5AE83A3E2529ECD80A1DBC58
880342319EAA1E1A0D5AA45BAAC4857610B33477
8DB0DC26A77F5E622BFBFAFFDFCE63948C7E3B5B
BC67DB594CBE96563AFE2CE165F2C107130FB2F0 (this relay)
C4FEABB1C0F7709312B33345040FBC29682877DE
F8F2B6BF6B2C2205CE0C110E23716F6A31D993D7
- Effective Member: 1
AB3CBBB2A6284CCDC2780512887D2385C4383CE3
- Alleged Members: 12
-
(they don't list you back)
3280B1A872FB26560BBD8DFF47633E16B762BACC (not in the network)
43731B9E8800EFB3EBCB12BE15AA00868CEF9F5F (not in the network)
51F0FE9C81C09AA3C399296FDE4A4EA611AFE183 (not in the network)
5D1ACF7998E783EE5AE83A3E2529ECD80A1DBC58
5F38E47C0C99DCB309F60D691A4857A1814ED647 (not in the network)
872BE4C147B7071C248D32EFF561D7468AC94A82 (not in the network)
90D76DEA5400FF1B6BC3EE3ADD5AC0347F3D4884 (not in the network)
A5424DA7CA2770D962A2CBF53970B7ABFC1F15B6 (not in the network)
CC57DC3D8211248A18038A44B39A852F5055AFD6 (not in the network)
E8953FFF6D47182B07C6D3F0E092F83D8E45D62F (not in the network)
FB86BC4CFC43F3637DA45B70986FEFD3F5C7CDB3 (not in the network)
FC088734EA8D7E6347D527815202B47830997614 (not in the network)
- Indirect Members: 0
- none
DNS Health
- Status
- Healthy (avg. 18.4s, 91st percentile)
- Query Domain
a2f40cafb2e247a79629edaece8de217.bc67db59.tor.exit.validator.1aeo.com- DNS Result
-
Resolved to
64.65.4.1 - Upstream Resolver
-
Local /24
(exit's own network)
Local /24 100% (~69 estimated queries) - Cross-Validation
- 4/4 instances succeeded
- First Hop
- tsusurf (US) 75CE164DC89DAEE3C06CEEA08A723172F8456D6B
- Exit Address Used
31.58.216.18- Per-Instance Results
-
Cross Validation Attempt 1: Success, 16.2s (cv1_w3) Cross Validation Attempt 2: Success, 14.4s (cv2_w3) Cross Validation Attempt 3: Success, 20.0s (cv3_w3) Cross Validation Attempt 4: Success, 23.0s (cv4_w3)
IPv4 Exit Policy Summary
accept:
  20-23
  43
  53
  79-81
  88
  110
  143
  194
  220
  389
  443
  464
  531
  543-544
  554
  563
  636
  706
  749
  853
  873
  902-904
  981
  989-995
  1194
  1220
  1293
  1500
  1533
  1677
  1723
  1755
  1863
  2082-2083
  2086-2087
  2095-2096
  2102-2104
  3128
  3389
  3690
  4321
  4643
  5050
  5190
  5222-5223
  5228
  5900
  6660-6669
  6679
  6697
  8000
  8008
  8074
  8080
  8082
  8087-8088
  8232-8233
  8332-8333
  8443
  8888
  9418
  9999-10000
  11371
  19294
  19638
  50002
  64738
IPv6 Exit Policy Summary
accept:
  20-23
  43
  53
  79-81
  88
  110
  143
  194
  220
  389
  443
  464
  531
  543-544
  554
  563
  636
  706
  749
  853
  873
  902-904
  981
  989-995
  1194
  1220
  1293
  1500
  1533
  1677
  1723
  1755
  1863
  2082-2083
  2086-2087
  2095-2096
  2102-2104
  3128
  3389
  3690
  4321
  4643
  5050
  5190
  5222-5223
  5228
  5900
  6660-6669
  6679
  6697
  8000
  8008
  8074
  8080
  8082
  8087-8088
  8232-8233
  8332-8333
  8443
  8888
  9418
  9999-10000
  11371
  19294
  19638
  50002
  64738
Full Exit Policy
reject 0.0.0.0/8:*
reject 169.254.0.0/16:*
reject 127.0.0.0/8:*
reject 192.168.0.0/16:*
reject 10.0.0.0/8:*
reject 172.16.0.0/12:*
reject 31.58.216.18:*
accept *:20-21
accept *:22
accept *:23
accept *:43
accept *:53
accept *:79
accept *:80-81
accept *:88
accept *:110
accept *:143
accept *:194
accept *:220
accept *:389
accept *:443
accept *:464
accept *:531
accept *:543-544
accept *:554
accept *:563
accept *:636
accept *:706
accept *:749
accept *:853
accept *:873
accept *:902-904
accept *:981
accept *:989-990
accept *:991
accept *:992
accept *:993
accept *:994
accept *:995
accept *:1194
accept *:1220
accept *:1293
accept *:1500
accept *:1533
accept *:1677
accept *:1723
accept *:1755
accept *:1863
accept *:2082
accept *:2083
accept *:2086-2087
accept *:2095-2096
accept *:2102-2104
accept *:3128
accept *:3389
accept *:3690
accept *:4321
accept *:4643
accept *:5050
accept *:5190
accept *:5222-5223
accept *:5228
accept *:5900
accept *:6660-6669
accept *:6679
accept *:6697
accept *:8000
accept *:8008
accept *:8074
accept *:8080
accept *:8082
accept *:8087-8088
accept *:8232-8233
accept *:8332-8333
accept *:8443
accept *:8888
accept *:9418
accept *:9999
accept *:10000
accept *:11371
accept *:19294
accept *:19638
accept *:50002
accept *:64738
reject *:*
Last fetch was at Wed, 04 Nov 2026 18:45:16 GMT.
Data from Tor CollecTor (authority votes, fetched 2026-11-04 18:45:05).
Each cell shows: your measured value | authority threshold. Green = meets, red = below. Flags: green = all authorities agree, yellow = partial.
| Authority | Running | Valid | Exit | MiddleOnly | BW Scan (Authority) |
v4 | v6 | Flags | Fast (BW|T) | Guard BW (BW|Threshold) | Guard WFU (M|T) | Guard TK (M|T) | Stable MTBF (M|T) | Stable Uptime (Relay|T) | Desc Published | Cons Wt (Authority) |
|---|---|---|---|---|---|---|---|---|---|---|---|---|---|---|---|---|
| bastet (US) | Yes | Yes | Yes | — | Y | Yes | Yes | Running, Valid, V2Dir, Fast, Stable, HSDir, Guard, Exit | 352.0 Mbit/s (M) | 816.0 Kbit/s | 352.0 Mbit/s (M) | 192.0 Mbit/s OR 16.8 Mbit/s | 99.7% | 98% | 23.4d | 8d | 13.0d | 8.4d | 5.5d | 5.2d | 2026-11-03 18:21:53 | 352.0 Mbit/s (M) |
| dannenberg (DE) | Yes | Yes | Yes | — | Y | Yes | Yes | Running, Valid, V2Dir, Fast, Stable, HSDir, Guard, Exit | 360.0 Mbit/s (M) | 816.0 Kbit/s | 360.0 Mbit/s (M) | 272.0 Mbit/s OR 16.8 Mbit/s | 99.9% | 98% | 22.1d | 8d | 13.2d | 9.5d | 5.5d | 5.5d | 2026-11-04 12:21:57 | 360.0 Mbit/s (M) |
| dizum (NL) | Yes | Yes | Yes | — | N | Yes | Yes | Running, Valid, V2Dir, Fast, Stable, HSDir, Guard, Exit | 80.0 Mbit/s (R) | 816.0 Kbit/s | 80.0 Mbit/s (R) | 80.0 Mbit/s OR 16.8 Mbit/s | 98.6% | 98% | 20.5d | 8d | 5.1d | 6.8d | 5.5d | 5.5d | 2026-11-04 12:21:57 | 80.0 Mbit/s (R) |
| faravahar (US) | Yes | Yes | Yes | — | Y | Yes | Yes | Running, Valid, V2Dir, Fast, Stable, HSDir, Guard, Exit | 80.0 Mbit/s (R) | 816.0 Kbit/s | 80.0 Mbit/s (R) | 80.0 Mbit/s OR 16.8 Mbit/s | 99.8% | 98% | 19.9d | 8d | 10.7d | 6.6d | 5.5d | 5.5d | 2026-11-04 12:21:57 | 80.0 Mbit/s (R) |
| gabelmoo (DE) | Yes | Yes | Yes | — | Y | Yes | Yes | Running, Valid, V2Dir, Fast, Stable, HSDir, Guard, Exit | 400.0 Mbit/s (M) | 816.0 Kbit/s | 400.0 Mbit/s (M) | 248.0 Mbit/s OR 16.8 Mbit/s | 99.9% | 98% | 23.8d | 8d | 18.7d | 10.9d | 5.5d | 5.5d | 2026-11-04 12:21:57 | 400.0 Mbit/s (M) |
| longclaw (US) | Yes | Yes | Yes | — | Y | Yes | N/T | Running, Valid, V2Dir, Fast, Stable, HSDir, Guard, Exit | 80.0 Mbit/s (R) | 816.0 Kbit/s | 80.0 Mbit/s (R) | 80.0 Mbit/s OR 16.8 Mbit/s | 99.9% | 98% | 23.3d | 8d | 18.5d | 11.1d | 5.5d | 5.5d | 2026-11-04 12:21:57 | 80.0 Mbit/s (R) |
| maatuska (SE) | Yes | Yes | Yes | — | N | Yes | Yes | Running, Valid, V2Dir, Fast, Stable, HSDir, Guard, Exit | 80.0 Mbit/s (R) | 816.0 Kbit/s | 80.0 Mbit/s (R) | 80.0 Mbit/s OR 16.8 Mbit/s | 99.2% | 98% | 20.0d | 8d | 4.5d | 2.4d | 5.5d | 5.5d | 2026-11-04 12:21:57 | 80.0 Mbit/s (R) |
| moria1 (US) | Yes | Yes | Yes | — | Y | Yes | Yes | Running, Valid, V2Dir, Fast, Stable, Guard, Exit | 360.0 Mbit/s (M) | 8.4 Mbit/s | 360.0 Mbit/s (M) | 192.0 Mbit/s OR 16.8 Mbit/s | 99.7% | 98% | 9.8d | 8d | 5113.0d | 7621.1d | 5.5d | 5.5d | 2026-11-04 12:21:57 | 360.0 Mbit/s (M) |
| tor26 (AT) | Yes | Yes | Yes | — | Y | Yes | Yes | Running, Valid, V2Dir, Fast, Stable, HSDir, Guard, Exit | 360.0 Mbit/s (M) | 816.0 Kbit/s | 360.0 Mbit/s (M) | 256.0 Mbit/s OR 16.8 Mbit/s | 99.9% | 98% | 23.2d | 8d | 18.5d | 10.8d | 5.5d | 5.5d | 2026-11-04 12:21:57 | 360.0 Mbit/s (M) |
N/T = this authority does not test IPv6 • — = not in this vote • Format: relay value | authority threshold • WFU = Weighted Fractional Uptime • TK = Time Known • Bandwidth source: (M) bandwidth-scanner measurement, (R) relay-reported, (U) unmeasured, counted as 0
Measured (M) = An authority's bandwidth-scanner measurement of your relay (
Measured= in its vote). An authority that has one uses it for the Fast and Guard flags, and the consensus weight is the median of these measurements when 3 or more authorities have one.Relay-reported (R) = The bandwidth your relay advertises: the lower of its observed bandwidth and its rate limit, capped at 10 MB/s (
Bandwidth= in every vote). An authority without a measurement uses it for flags, unless it has measurements for enough other relays (ignoring-advertised-bws=1); then your relay counts as 0 (U). It sets the consensus weight only when fewer than 3 authorities measured the relay, capped at 20 KB/s (maxunmeasuredbw) while 3 or more authorities publish measurements.Not published = The authority has no measurement of your relay in its vote and ignores relay-reported bandwidth, yet it voted Fast or its vote has no measurements at all: it judges your relay by a measurement kept from an earlier bandwidth file (0 if none), which its vote doesn't show.
Why different? A low measurement means the bandwidth scanners see your relay underperforming compared with other relays that report a similar speed. Votes list both values in kilobytes per second. Rules: Assigning flags in a vote, Computing a consensus.
Relay Uptime = From Onionoo API (last_restarted field). Self-reported uptime from descriptor. Same value for all authorities.
Authority Threshold = From CollecTor vote files (flag-thresholds stable-uptime). Each authority may have different thresholds.
Why two sources? Vote files contain authority thresholds but not per-relay uptime values. Onionoo aggregates relay descriptors which include uptime.